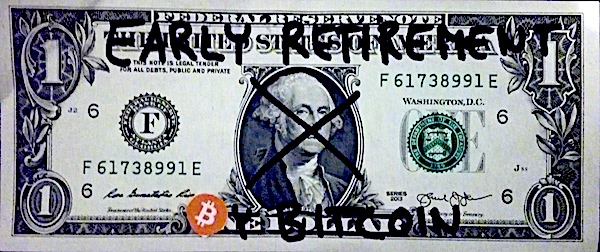
Another month served at the fiat mine, another salary hitting the bank account, another bitcoin purchase made at market price! As per usual I squander 500€ of my fresh salary and try to survive the month with the rest. The price this time was around 39100 € / BTC which means I got another ~.013 BTC added to the stack that stands at roughly 4.47 BTC today.
So, the ETFs are here. And nothing really happened, price wise. Well, maybe something happened, beforehand. But that was also pretty basic bitcoin pumping that happens all the time, with or without some bullish news. Don’t really know what to make of it. Are the ETFs not popular enough? Are the ETFs used to somehow dilute available supply? Is there a delay in the effect and we will see the ‘ETF bull’ eventually but not immediately? Don’t know. My guessing is, the availability of such products doesn’t immediately turn into a big demand. But maybe when the real bull market starts, for example half a year after the halving, maybe the ETFs will amplify the bull craziness making it possible for more than ‘the usual amount’ of people getting involved. We’ll see. In the meantime, gonna keep on stacking them sats! Let’s take a look at the charts:

The orange line (left axis) is my btc stack, ever increasing, getting closer to the next milestone of 4.5 coins. The green line (right axis) is the corresponding value in eurozone fiat terms, recently shooting up past 150k and aiming for a new all time high in the future not far from here. The black dashed line (right axis) is the total amount of money put it, mostly 500€ per month (3 exceptions, mentioned in the blog). The total amount after 6+ years is ~40k at the moment. Hell of a lot! But it really has happened one month at a time, 500€ at a time.
Bitcoin stacks are not built in a day.

The bars represent every bitcoin purchase I’ve ever made, starting from October 2017, 76 in total. Only 9 of these are underwater, the worst one being ~ -25%. The best buys from 2018 – 2019 bear market give me a return of +1200%. That’s your asymmetrical bet right there. You gotta be willing to go underwater for a while to get some +1000% returns in the long run. Some people (not gonna name anyone but Peter Schiff you pussy) are not willing to endure the minus twenty fives.

The orange line is the performance of my bitcoin savings strategy. The blue line is the performance of putting similar amounts on similar days into S&P (the standard boomer savings strategy). The bitcoin strategy has given me a profit of ~330% for the money put in, whereas the S&P strategy would have given me a measly profit of 42% for the money put in, after 6+ years (that can’t be more than inflation really). I made this chart because I used to be obsessed about the early retirement / financial independence thing, blogs like Mr Money Moustache, for example. Basically, they save as much as they can and buy the S&P with it every month. So, I felt like finding the cheat codes and wanted to track just how much better it is to always buy bitcoin instead. Feel free to share this chart to anyone in the FIRE sphere =D.

Here I’m comparing the performance of MSTR stock to GBTC that was the popular earlier way for bitcoin exposure. Not surprisingly, they go hand in hand but in general MSTR has been the better bet. The chart start when Microstrategy first announced their bitcoin treasury strategy. Interesting to see how the ETFs will affect this dynamic, if at all.
That’s a wrap! First post of the year. Gonna be an interesting one for sure. ETFs are already here, halving is coming soon, bull market might also start in full force within the year. Keep calm and stack sats!
————————-
Affiliate links:
Buy bitcoin at Swan
Buy bitcoin gear at Coinkite

You must be logged in to post a comment.